
Sleep sounds by the numbers
We ran the audio files behind our own sleep sounds through standard loudness and spectrum measurements. Here's what 32 hours of rain, noise and ambience look like as numbers, how we measured them, and what the numbers can and can't tell you.
Quick answer: We measured the audio files behind 20 of our sleep sounds. File loudness across our long videos ranged from -22.8 to -14.0 LUFS, white noise measured 5.2 LU louder than brown noise at the same signal power, and recordings all called rain ranged from nearly flat to steeper than brown noise. These are file measurements, not health claims.
Key facts
- Our 11 long video soundtracks span 8.8 LU in loudness, from -22.8 to -14.0 LUFS
- At identical signal power, our white noise measured -16.2 LUFS and our brown noise -21.0 LUFS
- Our 8-hour brown noise track falls about 15.9 dB per octave, far steeper than textbook brown noise at 6 dB
- Every long soundtrack stayed within 1.2 LU from one 10-minute stretch to the next
What this is: measurements of SleepBetter.ai's own audio files, made on October 30, 2026. Every number on this page describes a file, not a bedroom and not a person. Nothing here is a claim about sleep, health or hearing. For safe listening levels, see our guide to how loud sleep sounds should be.
What did we measure?
We took the audio behind 20 of our sleep sounds and ran each one through the same measurements. That's about 32.5 hours of audio in total.
- 11 long video soundtracks. These are the final audio masters of the long rain, noise and ambience videos in our video library, from a 30-minute power nap track to two 8-hour tracks.
- 5 sounds from our free web player. White, pink, brown and green noise are generated live in your browser on our free sleep sounds page. We rendered two minutes of each offline, using exactly the same code the page runs, so they could be measured like files. The fifth is the cabin rain loop the player streams.
- 4 short clips. Ocean, fireplace, stream and downpour audio from our 30-second videos. They were edited for social video, so we only use them for frequency balance, not loudness.
For every file we measured three things: how loud it is, how steady that loudness stays, and where its energy sits between deep bass and treble.
Finding 1: our own videos differ by 8.8 LU
Integrated loudness, measured in LUFS, is the standard way broadcasters and streaming services compare how loud programmes feel. It runs on a log scale like decibels: higher is louder, and a 10 LU step is a big, obvious jump.
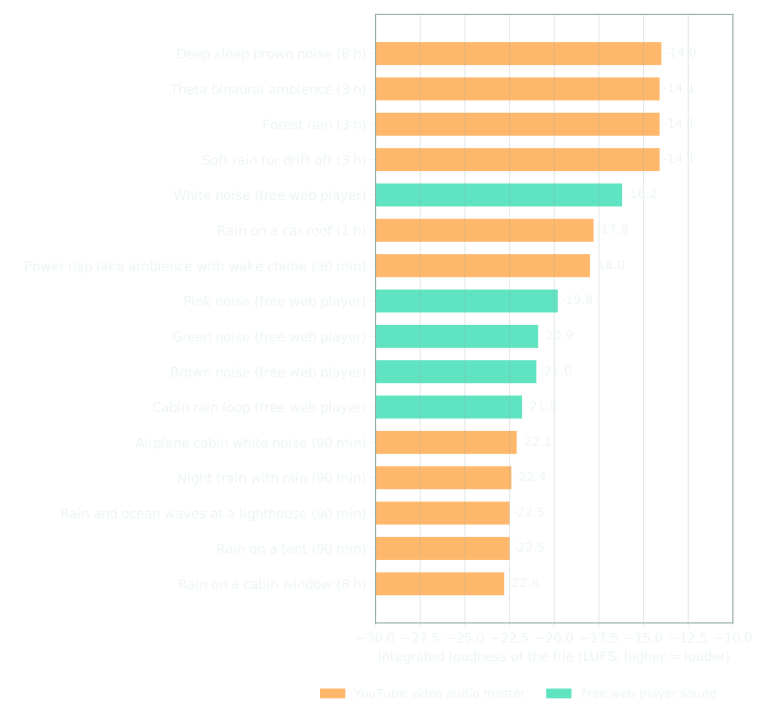
Our 11 long soundtracks span 8.8 LU, from -22.8 LUFS (rain on a cabin window, 8 hours) to -14.0 LUFS (deep sleep brown noise, 8 hours). Four of them sit at about -14 LUFS, a common target for online video. The other seven sit noticeably lower, between -22.8 and -17.8 LUFS.
What it means for you: don't trust the volume you used last night when you switch videos or apps. Start low and turn up until the noises that bother you blend in. Our volume guide has a simple test.
Finding 2: same power, different loudness
Our web player gives every noise color the same signal power (RMS 0.12 before the output gain). If loudness simply followed signal power, white, pink and brown noise would all measure the same. They don't:
| Web player sound | Integrated loudness | Spectral slope | Energy below 250 Hz |
|---|---|---|---|
| White noise | -16.2 LUFS | 0.0 dB/oct | 1.2% |
| Pink noise | -19.8 LUFS | -3.0 dB/oct | 36.8% |
| Green noise | -20.9 LUFS | -4.1 dB/oct | 4.1% |
| Brown noise | -21.0 LUFS | -5.7 dB/oct | 64.6% |
| Cabin rain loop | -21.8 LUFS | -7.5 dB/oct | 4.4% |
White noise measured 5.2 LU louder than brown noise at identical signal power. The reason is the K-weighting inside the loudness standard: it turns down deep bass and gives a little extra weight to the upper middle, roughly as our ears do. Brown noise keeps most of its energy in the bass, so a lot of its power counts for less.
This is one reason people often describe brown noise as "softer". If you're moving from white to brown noise, you may want a slightly higher volume for the same masking, and the reverse when moving back. The white vs pink vs brown noise guide explains the colors themselves.
Finding 3: "brown" and "rain" are not one sound
The spectral slope says how fast energy falls from bass to treble, measured in decibels per octave between 63 Hz and 8 kHz. Textbook white noise is 0, pink is -3 and brown is -6.
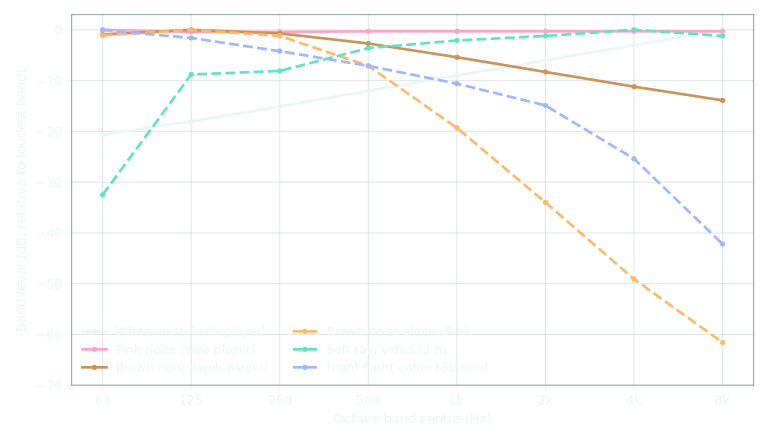
Our 8-hour brown noise video falls about 15.9 dB per octave, more than twice as steep as textbook brown noise. It has 82.9% of its energy below 250 Hz and almost none (0.0%) above 2 kHz, because the mix runs the noise through a 400 Hz low-pass filter. So it's really a deep rumble, darker than the brown noise most generators make. We think that's worth saying plainly: names like "brown noise" are loose, and two tracks with the same name can sound very different.
Rain varies even more. Across six of our rain soundtracks:
| Rain soundtrack | Spectral slope | Spectral centroid | Energy above 2 kHz |
|---|---|---|---|
| Soft rain (3 h) | -1.3 dB/oct | 3,350 Hz | 56.7% |
| Forest rain (3 h) | -1.5 dB/oct | 4,559 Hz | 63.2% |
| Rain on a car roof (1 h) | -5.4 dB/oct | 1,470 Hz | 27.6% |
| Rain and waves at a lighthouse (90 min) | -5.5 dB/oct | 1,250 Hz | 22.9% |
| Rain on a cabin window (8 h) | -7.7 dB/oct | 1,257 Hz | 16.4% |
| Rain on a tent (90 min) | -7.9 dB/oct | 959 Hz | 12.4% |
Light rain on leaves sits close to white noise, bright and hissy. Rain on a tent or a window is darker than brown noise. If one rain track feels too sharp, a different rain track may suit you better, a point we also make in rain sounds vs white noise.
The short clips follow the same pattern: the ocean clip has 87.8% of its energy below 250 Hz and the fireplace 81.8%, while the tropical downpour has 38.6% above 2 kHz. Our airplane cabin and night train tracks are bass-heavy too, with 84.5% and 81.1% of their energy below 250 Hz.
How steady are they?
A sleep sound that suddenly gets louder can be more noticeable than one that's simply loud. We checked steadiness two ways. Loudness range (EBU Tech 3342) was 2.5 LU or less for 10 of the 11 long soundtracks. The exception is the 30-minute power nap track, at 4.1 LU, because it ends with a wake-up chime on purpose.
We also split every soundtrack of 20 minutes or more into 10-minute stretches and took the median loudness of each. The quietest and loudest stretch of any soundtrack were never more than 1.2 LU apart, and that largest gap is across the 48 stretches of the 8-hour cabin window rain. No master came close to clipping: the highest true peak was -1.5 dBTP.
How we measured
- Loudness. FFmpeg's ebur128 filter, which implements ITU-R BS.1770 and EBU R 128: integrated loudness (LUFS), loudness range (LU), true peak (dBTP) and the 3-second short-term loudness series, which gave the 10-minute medians.
- Spectrum. Each file was mixed to mono at 48 kHz and analysed with Welch's method (8,192-point segments, Hann window). Files over 10 minutes were sampled as 20 evenly spaced 30-second excerpts. From the spectrum we took the spectral centroid, the median frequency, the share of energy below 250 Hz and above 2 kHz, octave band levels, and the slope from a straight-line fit of power in decibels against octaves between 63 Hz and 8 kHz.
- Check. As a sanity check, our generated white, pink and brown noise measured 0.0, -3.0 and -5.7 dB per octave, close to the textbook 0, -3 and -6.
- Generated noise. White, pink, brown and green noise were rendered for 120 seconds at 44.1 kHz with a fixed random seed, using a line-by-line copy of the web player's code, including its RMS normalisation and the green noise band-pass filter.
What these numbers can't tell you
- File level isn't room level. LUFS describes the file. How loud it is in your bedroom depends on your volume setting, speaker and distance. Only a sound meter in the room can tell you that.
- Nothing here is about sleep outcomes. We didn't test any sound on people. A flatter or darker spectrum isn't "better", just different.
- Small, one-company sample. These are our files only, 20 of them, so they show how much variety exists, not what's typical across all apps or channels.
- Short clips are excluded from loudness because they were edited for social video, and the web player's rain loop is reported at file level even though the player plays it at 80% volume.
Get the data
Every number on this page, plus the full octave band levels for all 20 files, is in one CSV: sleep-sounds-by-the-numbers.csv.
Cite this page
You're welcome to quote these numbers or reuse the charts. Please link to this page so readers can find the method and caveats.
Suggested citation: SleepBetter.ai. (2026, October 30). Sleep sounds by the numbers: loudness and spectrum measurements of 20 sleep sound recordings. https://sleepbetter.ai/guides/sleep-sounds-by-the-numbers/
HTML link: <a href="https://sleepbetter.ai/guides/sleep-sounds-by-the-numbers/">Sleep sounds by the numbers (SleepBetter.ai)</a>
Data: https://sleepbetter.ai/data/sleep-sounds-by-the-numbers.csv (measured October 30, 2026)
Questions
Is brown noise quieter than white noise?
At the same signal power, it usually measures quieter. In our test, white and brown noise were generated at exactly the same RMS level, yet white noise measured -16.2 LUFS and brown noise -21.0 LUFS. Loudness meters, like our ears, give less weight to deep bass than to the middle and upper frequencies.
Why do some sleep videos seem louder than others?
Because the files really are different. Across our own 11 long videos, integrated loudness ranged from -22.8 to -14.0 LUFS, a gap of 8.8 LU. When you switch from one video to another, set the volume again rather than trusting the last setting.
Is rain noise white, pink or brown?
It depends on the recording. Our rain soundtracks had spectral slopes from -1.3 dB per octave, close to white noise, to -7.9 dB per octave, steeper than brown noise. Light rain on leaves sounds bright; rain on a tent or a car roof is much darker.
Can I use this data?
Yes. The full table is free to download as a CSV. If you quote the numbers or reuse a chart, please link back to this page so readers can see the method and the caveats.
Sources
- ITU-R BS.1770: Algorithms to measure audio programme loudness and true-peak audio level.
- EBU Tech 3342: Loudness Range, a measure to supplement EBU R 128 loudness normalization.
- FFmpeg filters documentation: ebur128.
- Welch P. The use of fast Fourier transform for the estimation of power spectra. IEEE Transactions on Audio and Electroacoustics, 1967.
This page is general information about sound and sleep habits, not medical advice. If poor sleep is affecting your days, talk to a doctor or a sleep specialist.